


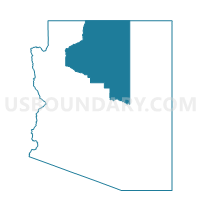
Tuba City CCD, Coconino County, Arizona
About
Outline

Summary
| Unique Area Identifier | 122823 |
| Name | Tuba City CCD |
| County | Coconino County |
| State | Arizona |
| Area (square miles) | 5,193.76 |
| Land Area (square miles) | 5,181.44 |
| Water Area (square miles) | 12.31 |
| % of Land Area | 99.76 |
| % of Water Area | 0.24 |
| Latitude of the Internal Point | 36.20604240 |
| Longtitude of the Internal Point | -111.26040210 |
| Total Population | 31,639 |
| Total Housing Units | 10,501 |
| Total Households | 8,984 |
| Median Age | 29 |
Maps

Graphs
Select a template below for downloading or customizing gragh for Tuba City CCD, Coconino County, Arizona


Neighbors
Neighoring County Subdivision (by Name) Neighboring County Subdivision on the Map
- Flagstaff CCD, Coconino County, AZ
- Hopi CCD, Coconino County, AZ
- Hopi CCD, Navajo County, AZ
- Indian Wells CCD, Navajo County, AZ
- Kaibab Plateau CCD, Coconino County, AZ
- Kayenta CCD, Navajo County, AZ
- Oljato CCD, San Juan County, UT
- Winslow-Holbrook CCD, Navajo County, AZ
Top 10 Neighboring Place (by Population) Neighboring Place on the Map
- Tuba City CDP, AZ (8,611)
- Page city, AZ (7,247)
- Kaibito CDP, AZ (1,522)
- LeChee CDP, AZ (1,443)
- Moenkopi CDP, AZ (964)
- Leupp CDP, AZ (951)
- Cameron CDP, AZ (885)
- Tonalea CDP, AZ (549)
- Bitter Springs CDP, AZ (452)
- Tolani Lake CDP, AZ (280)
Top 10 Neighboring Unified School District (by Population) Neighboring Unified School District on the Map
- Flagstaff Unified District, AZ (91,658)
- Tuba City Unified District, AZ (16,064)
- San Juan School District, UT (14,746)
- Page Unified District, AZ (13,046)
- Winslow Unified District, AZ (11,556)
- Kayenta Unified District, AZ (10,479)
- Fredonia-Moccasin Unified District, AZ (2,825)
- Grand Canyon Unified District, AZ (2,628)
Top 10 Neighboring State Legislative District Lower Chamber (by Population) Neighboring State Legislative District Lower Chamber on the Map
- State House District 1, AZ (217,022)
- State House District 3, AZ (216,687)
- State House District 5, AZ (192,258)
- State House District 2, AZ (177,904)
- State House District 69, UT (31,813)
Top 10 Neighboring State Legislative District Upper Chamber (by Population) Neighboring State Legislative District Upper Chamber on the Map
- State Senate District 1, AZ (217,022)
- State Senate District 3, AZ (216,687)
- State Senate District 5, AZ (192,258)
- State Senate District 2, AZ (177,904)
- State Senate District 27, UT (93,972)
Top 10 Neighboring 111th Congressional District (by Population) Neighboring 111th Congressional District on the Map
- Congressional District 2, AZ (972,839)
- Congressional District 2, UT (890,993)
- Congressional District 1, AZ (774,310)
Top 10 Neighboring Census Tract (by Population) Neighboring Census Tract on the Map
- Census Tract 21, Coconino County, AZ (7,247)
- Census Tract 22, Coconino County, AZ (6,457)
- Census Tract 13.02, Coconino County, AZ (5,536)
- Census Tract 9449, Coconino County, AZ (4,631)
- Census Tract 9606, Navajo County, AZ (4,527)
- Census Tract 9400.13, Navajo County, AZ (4,191)
- Census Tract 9450, Coconino County, AZ (4,180)
- Census Tract 9400.15, Navajo County, AZ (4,176)
- Census Tract 9452, Coconino County, AZ (4,101)
- Census Tract 9422.01, Coconino County, AZ (4,073)
Top 10 Neighboring 5-Digit ZIP Code Tabulation Area (by Population) Neighboring 5-Digit ZIP Code Tabulation Area on the Map
- 86001, AZ (40,776)
- 86004, AZ (37,338)
- 86047, AZ (14,970)
- 86045, AZ (11,354)
- 86040, AZ (10,283)
- 86046, AZ (6,090)
- 86044, AZ (4,251)
- 86023, AZ (2,627)
- 86053, AZ (2,311)
- 86020, AZ (1,941)
Data
Demographic, Population, Households, and Housing Units
** Data sources from census 2010 **
Show Data on Map
Download Full List as CSV
Download Quick Sheet as CSV
| Subject | This Area | Coconino County | Arizona | National |
|---|---|---|---|---|
| POPULATION | ||||
| Total Population Map | 31,639 | 134,421 | 6,392,017 | 308,745,538 |
| POPULATION, HISPANIC OR LATINO ORIGIN | ||||
| Not Hispanic or Latino Map | 30,528 | 116,255 | 4,496,868 | 258,267,944 |
| Hispanic or Latino Map | 1,111 | 18,166 | 1,895,149 | 50,477,594 |
| POPULATION, RACE | ||||
| White alone Map | 4,686 | 82,967 | 4,667,121 | 223,553,265 |
| Black or African American alone Map | 67 | 1,629 | 259,008 | 38,929,319 |
| American Indian and Alaska Native alone Map | 25,791 | 36,714 | 296,529 | 2,932,248 |
| Asian alone Map | 137 | 1,846 | 176,695 | 14,674,252 |
| Native Hawaiian and Other Pacific Islander alone Map | 5 | 164 | 12,648 | 540,013 |
| Some Other Race alone Map | 207 | 6,990 | 761,716 | 19,107,368 |
| Two or More Races Map | 746 | 4,111 | 218,300 | 9,009,073 |
| POPULATION, SEX | ||||
| Male Map | 15,539 | 66,666 | 3,175,823 | 151,781,326 |
| Female Map | 16,100 | 67,755 | 3,216,194 | 156,964,212 |
| POPULATION, AGE (18 YEARS) | ||||
| 18 years and over Map | 21,201 | 102,633 | 4,763,003 | 234,564,071 |
| Under 18 years | 10,438 | 31,788 | 1,629,014 | 74,181,467 |
| POPULATION, AGE | ||||
| Under 5 years | 2,851 | 8,945 | 455,715 | 20,201,362 |
| 5 to 9 years | 2,782 | 8,763 | 453,680 | 20,348,657 |
| 10 to 14 years | 2,904 | 8,599 | 448,664 | 20,677,194 |
| 15 to 17 years | 1,901 | 5,481 | 270,955 | 12,954,254 |
| 18 and 19 years | 1,238 | 7,843 | 190,627 | 9,086,089 |
| 20 years | 584 | 4,027 | 93,756 | 4,519,129 |
| 21 years | 446 | 3,705 | 89,342 | 4,354,294 |
| 22 to 24 years | 1,421 | 8,193 | 259,486 | 12,712,576 |
| 25 to 29 years | 2,068 | 9,943 | 439,998 | 21,101,849 |
| 30 to 34 years | 1,892 | 8,186 | 416,695 | 19,962,099 |
| 35 to 39 years | 1,818 | 7,849 | 415,693 | 20,179,642 |
| 40 to 44 years | 1,838 | 7,650 | 406,801 | 20,890,964 |
| 45 to 49 years | 2,051 | 8,664 | 427,022 | 22,708,591 |
| 50 to 54 years | 1,977 | 9,289 | 415,524 | 22,298,125 |
| 55 to 59 years | 1,655 | 8,677 | 375,268 | 19,664,805 |
| 60 and 61 years | 585 | 2,963 | 144,092 | 7,113,727 |
| 62 to 64 years | 731 | 3,720 | 206,868 | 9,704,197 |
| 65 and 66 years | 376 | 1,904 | 119,102 | 5,319,902 |
| 67 to 69 years | 519 | 2,559 | 163,764 | 7,115,361 |
| 70 to 74 years | 767 | 2,984 | 215,026 | 9,278,166 |
| 75 to 79 years | 581 | 2,035 | 162,261 | 7,317,795 |
| 80 to 84 years | 368 | 1,350 | 118,278 | 5,743,327 |
| 85 years and over | 286 | 1,092 | 103,400 | 5,493,433 |
| MEDIAN AGE BY SEX | ||||
| Both sexes Map | 29.00 | 31.00 | 35.90 | 37.20 |
| Male Map | 27.60 | 30.60 | 34.80 | 35.80 |
| Female Map | 30.60 | 31.40 | 37.20 | 38.50 |
| HOUSEHOLDS | ||||
| Total Households Map | 8,984 | 46,711 | 2,380,990 | 116,716,292 |
| HOUSEHOLDS, HOUSEHOLD TYPE | ||||
| Family households: Map | 6,972 | 29,656 | 1,576,520 | 77,538,296 |
| Husband-wife family Map | 4,081 | 21,005 | 1,146,036 | 56,510,377 |
| Other family: Map | 2,891 | 8,651 | 430,484 | 21,027,919 |
| Male householder, no wife present Map | 812 | 2,704 | 134,171 | 5,777,570 |
| Female householder, no husband present Map | 2,079 | 5,947 | 296,313 | 15,250,349 |
| Nonfamily households: Map | 2,012 | 17,055 | 804,470 | 39,177,996 |
| Householder living alone Map | 1,668 | 11,467 | 621,008 | 31,204,909 |
| Householder not living alone Map | 344 | 5,588 | 183,462 | 7,973,087 |
| HOUSEHOLDS, HISPANIC OR LATINO ORIGIN OF HOUSEHOLDER | ||||
| Not Hispanic or Latino householder: Map | 8,780 | 41,817 | 1,880,167 | 103,254,926 |
| Hispanic or Latino householder: Map | 204 | 4,894 | 500,823 | 13,461,366 |
| HOUSEHOLDS, RACE OF HOUSEHOLDER | ||||
| Householder who is White alone | 1,992 | 33,100 | 1,892,326 | 89,754,352 |
| Householder who is Black or African American alone | 30 | 526 | 92,994 | 14,129,983 |
| Householder who is American Indian and Alaska Native alone | 6,747 | 9,614 | 82,898 | 939,707 |
| Householder who is Asian alone | 57 | 533 | 57,594 | 4,632,164 |
| Householder who is Native Hawaiian and Other Pacific Islander alone | 2 | 47 | 3,443 | 143,932 |
| Householder who is Some Other Race alone | 59 | 1,998 | 200,098 | 4,916,427 |
| Householder who is Two or More Races | 97 | 893 | 51,637 | 2,199,727 |
| HOUSEHOLDS, HOUSEHOLD TYPE BY HOUSEHOLD SIZE | ||||
| Family households: Map | 6,972 | 29,656 | 1,576,520 | 77,538,296 |
| 2-person household Map | 1,828 | 12,008 | 665,956 | 31,882,616 |
| 3-person household Map | 1,299 | 6,129 | 322,155 | 17,765,829 |
| 4-person household Map | 1,260 | 5,523 | 288,309 | 15,214,075 |
| 5-person household Map | 1,073 | 3,097 | 162,449 | 7,411,997 |
| 6-person household Map | 611 | 1,434 | 76,255 | 3,026,278 |
| 7-or-more-person household Map | 901 | 1,465 | 61,396 | 2,237,501 |
| Nonfamily households: Map | 2,012 | 17,055 | 804,470 | 39,177,996 |
| 1-person household Map | 1,668 | 11,467 | 621,008 | 31,204,909 |
| 2-person household Map | 306 | 4,067 | 148,999 | 6,360,012 |
| 3-person household Map | 18 | 898 | 22,171 | 992,156 |
| 4-person household Map | 16 | 465 | 8,346 | 411,171 |
| 5-person household Map | 4 | 111 | 2,495 | 126,634 |
| 6-person household Map | 0 | 34 | 840 | 48,421 |
| 7-or-more-person household Map | 0 | 13 | 611 | 34,693 |
| HOUSING UNITS | ||||
| Total Housing Units Map | 10,501 | 63,321 | 2,844,526 | 131,704,730 |
| HOUSING UNITS, OCCUPANCY STATUS | ||||
| Occupied Map | 8,984 | 46,711 | 2,380,990 | 116,716,292 |
| Vacant Map | 1,517 | 16,610 | 463,536 | 14,988,438 |
| HOUSING UNITS, OCCUPIED, TENURE | ||||
| Owned with a mortgage or a loan Map | 1,957 | 17,618 | 1,132,662 | 52,979,430 |
| Owned free and clear Map | 4,805 | 10,825 | 439,025 | 23,006,644 |
| Renter occupied Map | 2,222 | 18,268 | 809,303 | 40,730,218 |
| HOUSING UNITS, VACANT, VACANCY STATUS | ||||
| For rent Map | 115 | 1,279 | 120,490 | 4,137,567 |
| Rented, not occupied Map | 54 | 127 | 5,449 | 206,825 |
| For sale only Map | 32 | 854 | 64,407 | 1,896,796 |
| Sold, not occupied Map | 6 | 96 | 10,550 | 421,032 |
| For seasonal, recreational, or occasional use Map | 641 | 12,057 | 184,327 | 4,649,298 |
| For migrant workers Map | 2 | 18 | 538 | 24,161 |
| Other vacant Map | 667 | 2,179 | 77,775 | 3,652,759 |
| HOUSING UNITS, OCCUPIED, AVERAGE HOUSEHOLD SIZE BY TENURE | ||||
| Total: Map | 3.52 | 2.69 | 2.63 | 2.58 |
| Owner occupied Map | 3.55 | 2.77 | 2.63 | 2.65 |
| Renter occupied Map | 3.42 | 2.56 | 2.62 | 2.44 |
| HOUSING UNITS, OCCUPIED, TENURE BY RACE OF HOUSEHOLDER | ||||
| Owner occupied: Map | 6,762 | 28,443 | 1,571,687 | 75,986,074 |
| Householder who is White alone Map | 1,388 | 20,478 | 1,324,907 | 63,446,275 |
| Householder who is Black or African American alone Map | 7 | 190 | 36,538 | 6,261,464 |
| Householder who is American Indian and Alaska Native alone Map | 5,249 | 6,223 | 47,653 | 509,588 |
| Householder who is Asian alone Map | 18 | 243 | 35,929 | 2,688,861 |
| Householder who is Native Hawaiian and Other Pacific Islander alone Map | 1 | 17 | 1,532 | 61,911 |
| Householder who is Some Other Race alone Map | 40 | 885 | 99,247 | 1,975,817 |
| Householder who is Two or More Races Map | 59 | 407 | 25,881 | 1,042,158 |
| Renter occupied: Map | 2,222 | 18,268 | 809,303 | 40,730,218 |
| Householder who is White alone Map | 604 | 12,622 | 567,419 | 26,308,077 |
| Householder who is Black or African American alone Map | 23 | 336 | 56,456 | 7,868,519 |
| Householder who is American Indian and Alaska Native alone Map | 1,498 | 3,391 | 35,245 | 430,119 |
| Householder who is Asian alone Map | 39 | 290 | 21,665 | 1,943,303 |
| Householder who is Native Hawaiian and Other Pacific Islander alone Map | 1 | 30 | 1,911 | 82,021 |
| Householder who is Some Other Race alone Map | 19 | 1,113 | 100,851 | 2,940,610 |
| Householder who is Two or More Races Map | 38 | 486 | 25,756 | 1,157,569 |
| HOUSING UNITS, OCCUPIED, TENURE BY HISPANIC OR LATINO ORIGIN OF HOUSEHOLDER | ||||
| Owner occupied: Map | 6,762 | 28,443 | 1,571,687 | 75,986,074 |
| Not Hispanic or Latino householder Map | 6,642 | 26,004 | 1,299,001 | 69,617,625 |
| Hispanic or Latino householder Map | 120 | 2,439 | 272,686 | 6,368,449 |
| Renter occupied: Map | 2,222 | 18,268 | 809,303 | 40,730,218 |
| Not Hispanic or Latino householder Map | 2,138 | 15,813 | 581,166 | 33,637,301 |
| Hispanic or Latino householder Map | 84 | 2,455 | 228,137 | 7,092,917 |
| HOUSING UNITS, OCCUPIED, TENURE BY HOUSEHOLD SIZE | ||||
| Owner occupied: Map | 6,762 | 28,443 | 1,571,687 | 75,986,074 |
| 1-person household Map | 1,207 | 5,920 | 353,988 | 16,453,569 |
| 2-person household Map | 1,694 | 10,647 | 608,970 | 27,618,605 |
| 3-person household Map | 969 | 4,157 | 221,739 | 12,517,563 |
| 4-person household Map | 921 | 3,747 | 197,439 | 10,998,793 |
| 5-person household Map | 806 | 2,025 | 104,232 | 5,057,765 |
| 6-person household Map | 449 | 915 | 47,784 | 1,965,796 |
| 7-or-more-person household Map | 716 | 1,032 | 37,535 | 1,373,983 |
| Renter occupied: Map | 2,222 | 18,268 | 809,303 | 40,730,218 |
| 1-person household Map | 461 | 5,547 | 267,020 | 14,751,340 |
| 2-person household Map | 440 | 5,428 | 205,985 | 10,624,023 |
| 3-person household Map | 348 | 2,870 | 122,587 | 6,240,422 |
| 4-person household Map | 355 | 2,241 | 99,216 | 4,626,453 |
| 5-person household Map | 271 | 1,183 | 60,712 | 2,480,866 |
| 6-person household Map | 162 | 553 | 29,311 | 1,108,903 |
| 7-or-more-person household Map | 185 | 446 | 24,472 | 898,211 |
Loading...